Documenting history in Turkey


Aylin Ulman

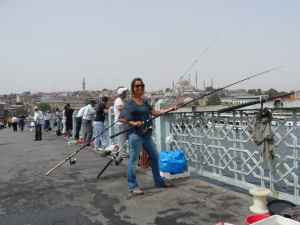
The author conducting research on recreational anglers on Galata Bridge, in the Golden Horn estuary of Istanbul (© A. Ulman)

by Aylin Ulman

In 2011, I began working for the Sea Around Us Project to complete catch reconstructions for Eastern Mediterranean and Black Sea countries. I quickly realized, while studying Turkey’s fisheries, that some marine ecosystems of Turkey recently underwent immense reductions of commercial species [1], leading to entire trophic shifts, but little data were available to explain these issues. At the beginning of my MSc with Daniel Pauly in 2012, it was decided that I’d go to Turkey to document the shifting baselines syndrome, i.e., gradual shifts in perception of the ecosystem, and collect details on these missing species/habitats.

My father was part of this study, as he is part of the first generation of scuba divers from Istanbul in the late 1950s and remembers a time long gone-by, when the Bosphorus was pristine and teeming with marine life. He has always been a typical eastern Mediterranean fisher, which does not normally go well with proud marine conservationists such as me. However, documenting shifting baselines in Turkey allowed me to turn his older generation’s Turkish traditional ecological knowledge (TEK) into recording the missing pieces of biological history.

To assess the shifting baselines syndrome, I compared today’s level of fishing effort, catch amounts, catch composition, and mean sizes to the time when these fisheries began; had them rate the quality of fishing now and when they first started; asked about any local extirpations or serious collapses in fish abundances; asked about the changes in catch of several other key taxa; and then queried the fishers about how they would improve fisheries.

The present plight of Turkish fisheries are likely a combination of the following: they have a tremendous fishing fleet (over 17,000 commercial vessels), very sophisticated technology (i.e., sonars and GPS), no catch restrictions, little enforcement of regulations, and also grapple with pollution issues.

I attended meetings for both the small-scale and industrial sectors and quickly realized that some sectors were more affected by the changes in biodiversity and catches than others. Consequently, I decided to interview fishers from all sectors (industrial, artisanal, and recreational) to understand their unique perspectives. Thanks to my prior work with the Sea Around Us, I knew over 100 Turkish names for fish, which was essential in conducting my surveys. I concentrated mostly on the Istanbul Bosphorus (where fishers depart to fish each of Turkey’s four seas), the Dardanelles (home to the most productive migration route for the key pelagic species), and the southwestern peninsula (which separates the Aegean Sea from the Mediterranean).

I first began my survey training on my father’s fishing friends in Datça, on the very southwestern peninsula, where he is the vice-president of the local fisheries co-operative. Everywhere, fishers were very open and helpful to me, which surprised me. Many were asking me: “Why does our government not try to learn how our seas have changed, yet a Canadian is out there with us trying to understand it?” I then realized just how privileged we are to be able to conduct this type of study. I was most surprised by how welcomed I was by the industrial fishers. I had gone there with a preconceived notion that these were the bad guys, wielding an immense fishing power. However, I quickly learned that these were the true ‘traditional’ fishers of the country, many whose families had been fishing for hundreds of years. They really care about the future of the fisheries and are desperately seeking some sort of output control to manage the stocks.

As I surveyed each fishing sector, and made many new friends, I gained new insights into a few common illegal fisheries of the Bosphorus, like the sea snail, Mediterranean mussel and bottom trawl fisheries, and now I have numbers to better estimate them.

I realized that the rate of ecological change is unbelievable for certain areas. For example, the Golden Horn estuary of the Bosphorus was teeming with swordfish, bluefin tuna, lobsters and Atlantic mackerel just 60 years ago, all of which seem to have vanished since the 1970s. Older fishers rarely bring up these species in conversation anymore, but are still haunted by their disappearances.

If I had to remember just a few quotes from this field trip, they would be:

-“Forget about making money [fishing], we do not even enjoy this anymore”;
-“30 years ago, 3 months of fishing would leave your pockets full for the other 9 months, now we fish every day and can barely afford our bread”;
-“Both small-scale and medium-scale fisheries are just not viable anymore, only the large-scale fisheries can survive, we need to find other work to complement our fishing salaries”; and
-“We have seen the best fishing years imaginable, but our children will only know those years through encyclopedias”.

On a side note, I was staying in Taksim Square when I was in Istanbul, where east meets west, and ancient history is met with modernity. There, I got to witness the Turkish national revolution, and its daily progression first hand. Its early stages were a very elated street party, comparable in my lifetime only to the Toronto after the Blue Jay’s World Series wins of 1992 and 1993. The educated half of the country united for the first time in history in Taksim Square to oppose actions of the Prime Minister. The protesters went from feeling utterly powerless to realizing that united they were strong, and that the world indeed was listening (for a little while anyways). I have never felt more proud to be Turkish, that is, until they began to use tear gas; I then realized that human rights and democracy have a different meaning than in Canada, and that it was better to be safe than arrested…

The shifted baselines of Turkey had not been previously studied. There is no other way to find out this information besides speaking to the fishers whom have witnessed these changes first hand. I hope to make my findings accessible to the fishing community in their local publications so that those without the prior ecological knowledge can at least try to imagine it, and even pass it down. Now that we know that Turkish citizens have a voice, it is now time for Turkish fishers to have a voice.

References

Ulman A, Bekişoğlu Ş, Zengin M, Knudsen S, Ünal V, Mathews C, Harper S, Zeller D and Pauly D (2013) From bonito to anchovy: a reconstruction of Turkey’s marine fisheries catches (1950-2010). Mediterranean Marine Science 14(2): 309-342.

TED Talk: Daniel Pauly on Shifting Baselines

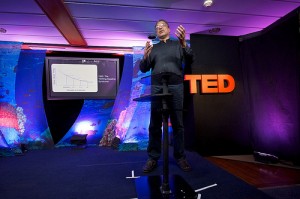
Daniel Pauly’s TED talk on Shifting Baselines is finally up! Watch the video, or read the transcript below:

I’m going to speak about a tiny, little idea. And this is about shifting baseline. And because the idea can be explained in one minute, I will tell you three stories before to fill in the time. And the first story is about Charles Darwin, one of my heroes. And he was here, as you well know, in ’35. And you’d think he was chasing finches, but he wasn’t. He was actually collecting fish. And he described one of them as very “common.” This was the sailfin grouper. A big fishery was run on it until the ’80s. Now the fish is on the IUCN Red List. Now this story, we have heard it lots of times on Galapagos and other places, so there is nothing particular about it. But the point is, we still come to Galapagos. We still think it is pristine. The brochures still say it is untouched. So what happens here?

The second story, also to illustrate another concept, is called shifting waistline. (Laughter) Because I was there in ’71, studying a lagoon in West Africa. I was there because I grew up in Europe and I wanted later to work in Africa. And I thought I could blend in. And I got a big sunburn, and I was convinced that I was really not from there. This was my first sunburn.

And the lagoon was surrounded by palm trees, as you can see, and a few mangrove. And it had tilapia about 20 centimeters, a species of tilapia called blackchin tilapia. And the fisheries for this tilapia sustained lots of fish and they had a good time and they earned more than average in Ghana. When I went there 27 years later, the fish had shrunk to half of their size. They were maturing at five centimeters. They had been pushed genetically. There were still fishes. They were still kind of happy. And the fish also were happy to be there. So nothing has changed, but everything has changed.

My third little story is that I was an accomplice in the introduction of trawling in Southeast Asia. In the ’70s — well, beginning in the ’60s — Europe did lots of development projects. Fish development meant imposing on countries that had already 100,000 fishers to impose on them industrial fishing. And this boat, quite ugly, is called the Mutiara 4. And I went sailing on it, and we did surveys throughout the southern South China sea and especially the Java Sea. And what we caught, we didn’t have words for it. What we caught, I know now, is the bottom of the sea. And 90 percent of our catch were sponges, other animals that are fixed on the bottom. And actually most of the fish, they are a little spot on the debris, the piles of debris, were coral reef fish. Essentially the bottom of the sea came onto the deck and then was thrown down.

And these pictures are extraordinary because this transition is very rapid. Within a year, you do a survey and then commercial fishing begins. The bottom is transformed from, in this case, a hard bottom or soft coral into a muddy mess. This is a dead turtle. They were not eaten, they were thrown away because they were dead. And one time we caught a live one. It was not drowned yet. And then they wanted to kill it because it was good to eat. This mountain of debris is actually collected by fishers every time they go into an area that’s never been fished. But it’s not documented.

We transform the world, but we don’t remember it. We adjust our baseline to the new level, and we don’t recall what was there. If you generalize this, something like this happens. You have on the y axis some good thing: biodiversity, numbers of orca, the greenness of your country, the water supply. And over time it changes — it changes because people do things, or naturally. Every generation will use the images that they got at the beginning of their conscious lives as a standard and will extrapolate forward. And the difference then, they perceive as a loss. But they don’t perceive what happened before as a loss. You can have a succession of changes. At the end you want to sustain miserable leftovers. And that, to a large extent, is what we want to do now. We want to sustain things that are gone or things that are not the way they were.

Now one should think this problem affected people certainly when in predatory societies, they killed animals and they didn’t know they had done so after a few generations. Because, obviously, an animal that is very abundant, before it gets extinct, it becomes rare. So you don’t lose abundant animals. You always lose rare animals. And therefore they’re not perceived as a big loss. Over time, we concentrate on large animals, and in a sea that means the big fish. They become rarer because we fish them. Over time we have a few fish left and we think this is the baseline.

And the question is, why do people accept this? Well because they don’t know that it was different. And in fact, lots of people, scientists, will contest that it was really different. And they will contest this because the evidence presented in an earlier mode is not in the way they would like the evidence presented. For example, the anecdote that some present, as Captain so-and-so observed lots of fish in this area cannot be used or is usually not utilized by fishery scientists, because it’s not “scientific.” So you have a situation where people don’t know the past, even though we live in literate societies, because they don’t trust the sources of the past.

And hence, the enormous role that a marine protected area can play. Because with marine protected areas, we actually recreate the past. We recreate the past that people cannot conceive because the baseline has shifted and is extremely low. That is for people who can see a marine protected area and who can benefit from the insight that it provides, which enables them to reset their baseline.

How about the people who can’t do that because they have no access — the people in the Midwest for example? There I think that the arts and film can perhaps fill the gap, and simulation. This is a simulation of Chesapeake Bay. There were gray whales in Chesapeake Bay a long time ago — 500 years ago. And you will have noticed that the hues and tones are like “Avatar.” (Laughter) And if you think about “Avatar,” if you think of why people were so touched by it — never mind the Pocahontas story — why so touched by the imagery? Because it evokes something that in a sense has been lost. And so my recommendation, it’s the only one I will provide, is for Cameron to do “Avatar II” underwater.

Thank you very much.

Atlantic Cod: Past and Present

Post-doctoral research fellow Ashley McCrea Strub and Daniel Pauly report on their recent efforts to help artist Maya Lin on her latest project on shifting baselines. They explain in the newsletter and below:

In February, Dr Pauly was contacted by Maya Lin, esteemed artist and architect best-known for designing the Vietnam Veteran’s Memorial in Washington D.C. She is creating an exhibit to illustrate severe declines in species due to human exploitation, and asked Daniel if the Sea Around Us could provide ideas and information for a fish species. When considering overfishing and the collapse of fisheries, Atlantic cod (Gadus morhua) is typically one of the first species that springs to mind. Cod occurs throughout the North Atlantic, along the shores of the first countries to develop industrial fisheries, notably England. The different cod stocks, (e.g., in the North Sea), are generally in parlous states, and those of the Northwestern Atlantic, off the coast of the United States and Canada, are no exception. Indeed, the collapse of eastern Canadian stocks off the coast of Newfoundland in 1992 had devastating economic, social and ecological consequences still visible today.

At the end of the last ice age, nearly 10,000 years ago, the availability and expansion of capelin and herring following the retreat of sea ice provided an abundant food source enabling the proliferation of Atlantic cod in the Northwest Atlantic (Rose 2007). The great abundance of this predator in ecosystems had a dominating influence over the community. Historical records indicate that massive populations of this predominantly bottom-feeding species were targeted by fisheries as early as the 15th century (Hutchings and Myers 1994). Technological advances allowed fisheries for cod to develop from hook-and-line to cod traps in the 1860s, the latter becoming larger and more efficient over time. The traps were then complemented by gill nets, but the key change was the introduction of bottom trawling early in the 20th century in New England as well as during the mid-20th century in Eastern Canada. As the vessels supporting these various domestic operations grew in size and power, distant-water factory trawlers, mostly from Europe, but some from as far as East Asia, were added to the fishery and generated catches in excess of 800,000 tonnes in the late 1960s and early 1970s. However, Atlantic cod is a relatively long-lived, slow growing species whose productive capacity could not keep up with the increasing rate of mortality due to fishing. As the great majority of spawning adults were packed into ships’ freezers, catches began to decline. By 1975, Canada and the United States declared national jurisdiction over what later became their 200 nautical-mile ‘Exclusive Economic Zones’, indirectly claiming ownership over the dwindling cod stocks and forcing out foreign fleets. The reduction in fishing, and recovery of cod that followed, was short-lived as overly optimistic fishery management measures and excessive subsidization led to record-low levels of biomass and a resultant fishing moratorium on the largest Canadian stocks in 1992. Despite significantly reduced fishing pressure, most stocks of cod in the Northwest Atlantic are still struggling to rebuild, and remain classified as ‘overfished.’

To help Maya Lin with the creation of her art exhibit, we conducted a study to help us better understand the extent of overfishing and the recent state of Atlantic cod off the eastern coast of Canada and the U.S., relative to a time when this species was still the most abundant predator in the region. To begin, information regarding the relative abundance of Atlantic cod from the northern coast of Labrador to Cape Hatteras, North Carolina was obtained from the global fisheries database developed and maintained by the Sea Around Us Project at the Fisheries Centre, University of British Columbia. Using historical spatial distribution data, as well as biological data including preferred depth, latitudinal limits and proximity to critical habitat, the likely geographic distribution of over 1000 commercially fished species, including Atlantic cod, has been defined (Watson et al. 2004; Close et al. 2006). This database enables the production of maps illustrating the relative abundance or likelihood of locating a particular species in a spatial grid of cells measuring 0.5° latitude by 0.5° longitude. Populating such a map to reflect the actual numbers or biomass of fish present in a given area during a specific time period is then possible given suitable data on fish density.

Information regarding the size of the Atlantic cod population in approximately 1850 was gathered from an analysis of mid-19th century logbooks maintained by a handline fleet that fished the Scotian Shelf, the centre of the range of Northwestern Atlantic cod, prior to the industrialization of fishing (Rosenberg et al. 2005). Due to the relatively low level of fishing pressure, this population was assumed, for the purposes of this study, to be relatively close to its unfished maximum at this time. Using detailed, spatially specific logs, Rosenberg et al. (2005) estimated the historical biomass of cod on the eastern and western Scotian Shelf (encompassing an area of over 160,000 km2) as 1.26 million tonnes. Accordingly, the average biomass density of cod on the Scotian Shelf in 1850 was approximately 8 tonnes per km2. In the absence of similar information for other areas, this estimate of average density was assumed to be representative of the entire region considered here. To create a map of the density of cod biomass in 1850, this average density was scaled according to spatially specific estimates of the relative abundance of cod, resulting in values defining the density of cod in each grid cell included in the study region.

To estimate recent biomass, the results of stock assessments conducted by the U.S. National Marine Fisheries Service (NMFS) and Fisheries and Oceans Canada (DFO) were assembled. As stock assessments have not been performed for every Northwestern Atlantic cod stock in the past year, and to avoid uncertainty associated with the most recent assessments, biomass estimates for 2005 were collected for each stock.

This process enabled the production of maps of cod biomass density as well as the approximation of total biomass for the years 1850 and 2005. As estimates of fish population size are typically based partially or wholly on records of catches from previous years, the population considered usually includes those individuals that are vulnerable to fishing gear (e.g., age 3-4+ Northwest Atlantic cod) or sexually-mature individuals (i.e. the spawning stock, age 5-7 in the case of Northwest Atlantic cod). Unless otherwise noted, population size estimates calculated in this study refer to the portion of the Northwest Atlantic cod population vulnerable to fishing.

In addition to the total size of the Northwest Atlantic cod stock during these contrasting time periods, the change in size of an ‘average cod’ since 1850 due to the effects of (over)fishing was also estimated. Calculating average cod size first required biological information describing the rate at which this species grows in length and weight over its lifetime (Sinclair 2001). When used in conjunction with the approximate total mortality rate (due to both natural causes and fishing) during 1850 and 2005, the average length and weight of a cod during each of these time periods was calculated1.

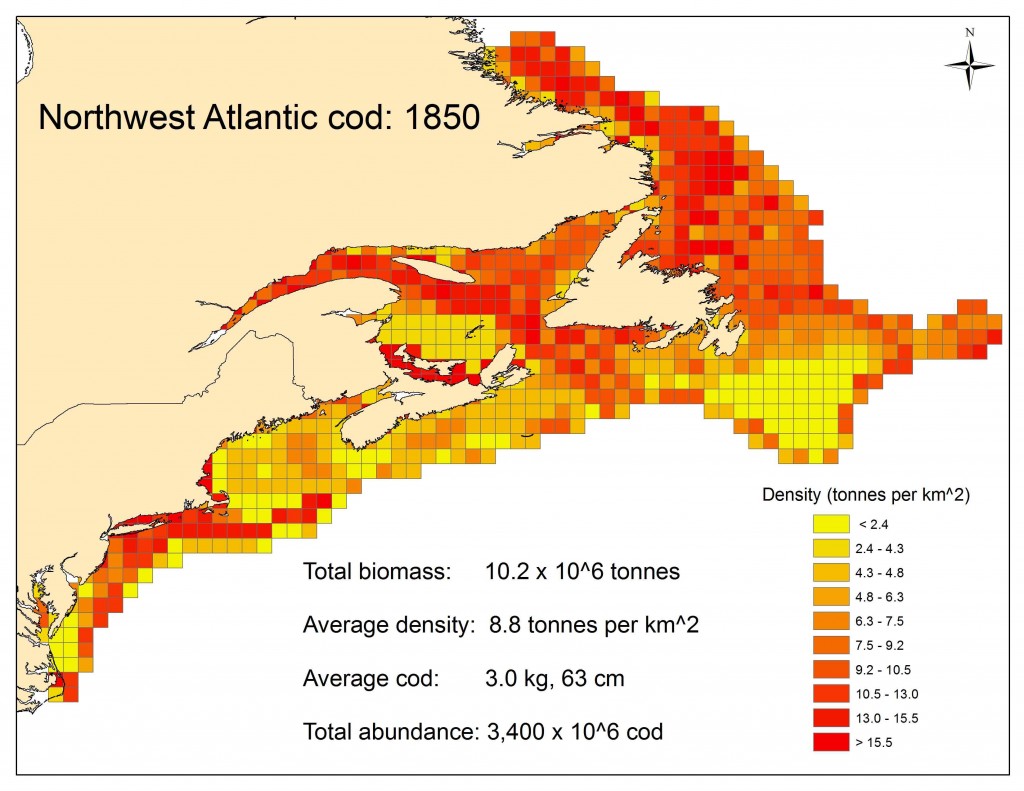
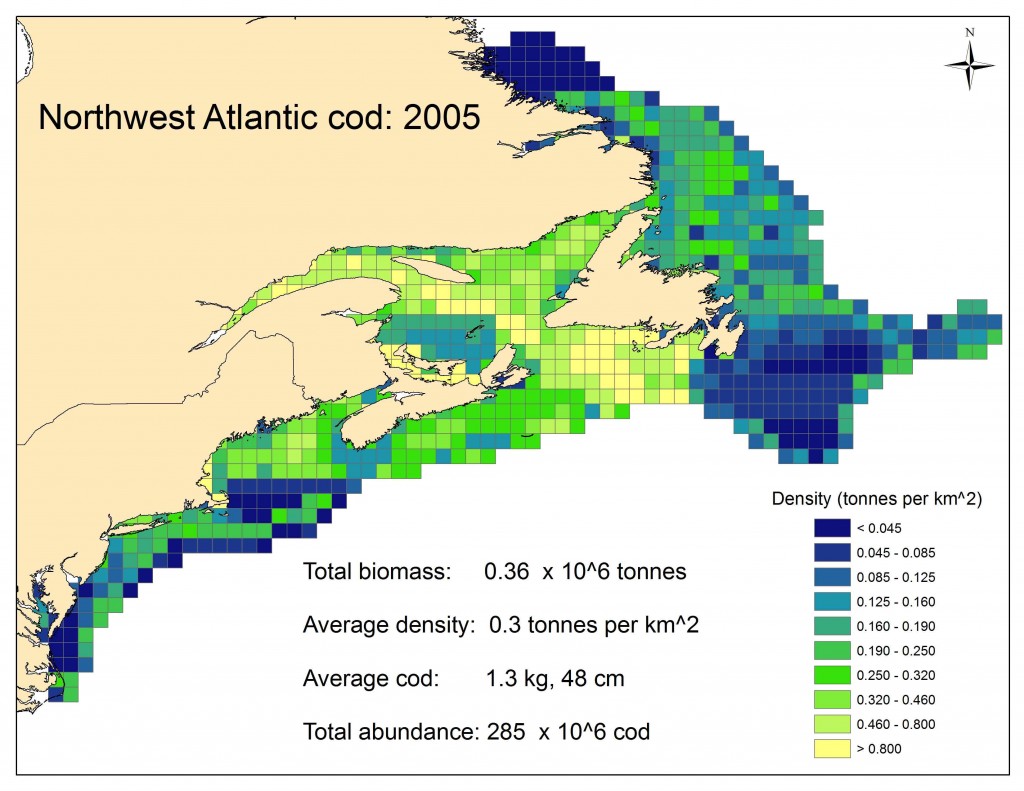
The maps created as a result of this study provide very different pictures of the abundant cod population in the Northwestern Atlantic prior to the onset of industrial-scale fishing in 1850 (Figure 1) and the severely depleted population following decades of intense fishing pressure in 2005 (Figure 2). In 1850, the total biomass of Atlantic cod was approximately 10.2 billion (10.2 x 10⁶) tonnes. By 2005, it was estimated that this biomass had decreased by over 96% to 0.36 x 10⁶ tonnes. Thus, the average density of cod biomass across the study region fell from 8 tonnes/km2 to 0.3 tonnes/km2, 3.5% of the initial value.

Fishing not only reduces population abundance, but also the size of an average fish in the population. Thus, in 1850, the average cod more than 3 years in age would have been about 63 cm in length and weighed 3.0 kg, while the average mature adult was 78 cm and weighed nearly 6 kg. By 2005, the size of an average cod greater than age 3 had fallen to 58 cm and 1.3 kg, and an average mature cod measured 68 cm and weighed 3.6 kg. It is important to note that the ‘average cod’ size in 1850 presented here is conservative and may be an underestimate of the true average size during this time period. This is due to the fact that most studies of Northwest Atlantic cod growth were relatively recent and parameter estimates were based on fish sampled from stocks already affected by many years of fishing. Thus, potential fisheries-induced changes in growth rate were not considered here.

Knowledge of population biomass and average weight enables an approximation of the number of Atlantic cod during each time period. In 1850 the population of Atlantic cod in this region was composed of roughly 3.4 trillion (3,400 x 106) individuals, and had decreased by approximately 92% by 2005 (i.e., to 285 billion or 285 x 106 cod). As younger, smaller individuals tend to be more abundant in a population, particularly in the case of heavily fished populations, merely analyzing the change in abundance of cod masks the true effects of overfishing; biomass was nearly 30 times lower in 2005 relative to 1850, while the abundance of cod was only 12 times lower in 2005 compared to 1850.

At a time when healthy, under-exploited fish stocks appear to be the exception rather than the rule across the globe and the ‘shifting-baselines’ syndrome has become widespread, numbers such as those presented here provide a perspective on the extent of human impacts on species and ecosystems, and of what we have lost. The data and maps generated as a result of this study will be used by Maya Lin to guide the design of her upcoming exhibit, providing an exciting vehicle for the Sea Around Us Project to communicate our work to a broad audience.

References
Close, C., W. Cheung, S. Hodgson, V. Lam, R. Watson and D. Pauly. (2006). Distribution ranges of commercial fishes and invertebrates, p. 27-37 In: Palomares, M.L.D., K.I. Stergiou and D. Pauly (Editors). 2006. Fishes in Databases and Ecosystems. Fisheries Centre Research Reports 14(4).

Hutchings, J.A. and R.A. Myers. (1994). What can be learned from the collapse of a renewable resource? Atlantic Cod, Gadus morhua, of Newfoundland and Labrador. Canadian Journal of Fisheries and Aquatic Sciences 51: 2126-2146.

Rose, G. (2007). Cod: An Ecological History of the North American Fisheries. Breakwater Books LTD., St. John’s, Newfoundland. 580 pp.

Rosenberg, A.A., W. J. Bolster, K.E. Alexander, W. B. Leavenworth, A.B. Cooper, and M.G. McKenzie. (2005). The history of ocean resources: modeling cod biomass using historical records. Frontiers in Ecology and the Environment 3: 84-90.

Sinclair, A.F. (2001) Natural mortality of cod (Gadus morhua) in the southern Gulf of St. Lawrence.ICES Journal of Marine Science 58:1-10.

Watson, R., A. Kitchingman, A. Gelchu, and D. Pauly. (2004). Mapping global fisheries: sharpening our focus. Fish and Fisheries 5: 168-177.

Endnote: Cod were assumed to grow in length according to the von Bertalanffy growth equation, where Linf = 118 cm, K = 0.11 year-1, and t0 = -0.44 yrs. (Sinclair 2001). Total length (cm) was then converted to weight (kg) using the relationship W = 0.0081*L3.03 (www.fishbase.org). The natural mortality rate (M) was assumed to equal 0.2 year-1. Fishing mortality (F) for the entire study region was calculated using the mean F reported by each stock assessment, weighted according to the estimated biomass of each assessed stock, resulting in an estimate of 0.3 year-1 for 2005.

Mission Blue a Success

Individuals onboard Mission Blue, a week long TED-sponsored journey around the Galapagos to raise awareness and money for the oceans, have donated more than $15 million to ocean conservation groups to sponsor education, protection of the Galapagos, eliminate fisheries subsidies, and more. The Sea Around Us Project’s Daniel Pauly was one of the many qualified speakers onboard the boat. Watch for an online version of Dr. Pauly’s talk on shifting baselines coming soon…