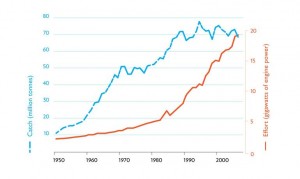
 Global fishing effort — as measured by engine power expended — has increased 10-fold since the 1950s, according to a new paper led by the Sea Around Us Project’s Reg Watson and published in the journal Fish and Fisheries. However, global catches are not managing to keep up the pace. Read more about the findings at Nature and at the Pew Environment Group website.
Tag: expansion
Scientific American Article Explores Catch Data Controversy
 A recent study by Trevor Branch and colleagues asserted that the decline in the mean trophic index is no longer present in the global catch data. But does it really cast doubt on the depletion of big ocean species?
In an article published today at Scientific American, journalist Mike Orcutt explores how best to measure commercial fishing’s impact on ocean biodiversity. He discusses the findings of Brach et al. in light of the new study quantifying fisheries expansion. Orcutt reports:
Pauly says the new PLoS One paper “completely invalidates” Branch’s Nature paper because the authors failed to account for the spatial expansion described in the former. As fisheries move offshore, he says, they first target large fish high on the food web—just as they did closer to shore. “Hence, moving offshore will mask inshore declines in mean trophic levels.”
Read the full article here.
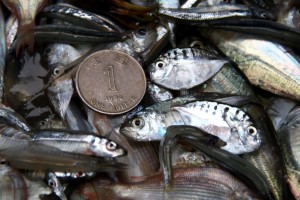
Photo: Tiny fish caught by a trawler off of Hong Kong by Stanley Shea/BLOOM.
New Study Quantifies Expansion of Fisheries
 While it is widely-recognized that fishing boats have moved further offshore and deeper in the hunt for seafood, the Sea Around Us Project, in collaboration with the National Geographic Society, recently published in PloS ONE the first study to quantify global fisheries expansion.
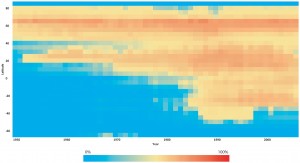
The study reveals that fisheries expanded at a rate of one million sq. kilometres per year from the 1950s to the end of the 1970s. The rate of expansion more than tripled in the 1980s and early 1990s – to roughly the size of Brazil’s Amazon rain forest every year.
Between 1950 and 2005, the spatial expansion of fisheries started from the coastal waters off the North Atlantic and Northwest Pacific, reached into the high seas and southward into the Southern Hemisphere at a rate of almost one degree latitude per year. It was accompanied by a nearly five-fold increase in catch, from 19 million tonnes in 1950, to a peak of 90 million tonnes in the late 1980s, and dropping to 87 million tonnes in 2005. Now we have run out of room to expand fisheries.
The image here (click to enlarge) shows a time series of areas exploited by marine fisheries by latitude class, expressed as a percentage of the total ocean area.

