Fisheries catch re-estimates for the Baltic Sea

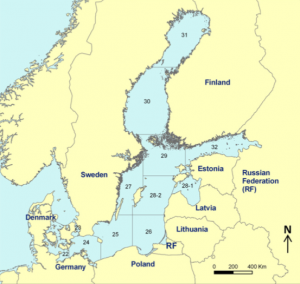
Another piece in the puzzle of true global fish catches is now in press at the journal Fisheries Research. The work re-estimates total catches for the nine countries fishing in the Baltic Sea. The new estimates, a team effort by several Sea Around Us members and led by Dirk Zeller, are 30% higher than official reports for 1950-2007.

The full reference for the work is: Zeller, D., Rossing, P., Harper, S., Persson, L., Booth, S. and Pauly, D. (in press) The Baltic Sea: estimates of total fisheries removals 1950-2007. Fisheries Research.

Arctic Fish Catches Underreported

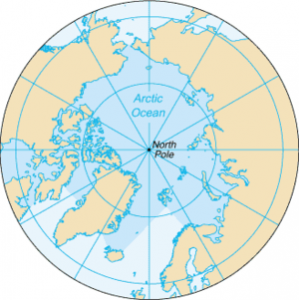
Fisheries catches in the Arctic totaled 950,000 tonnes from 1950 to 2006, almost 75 times the amount reported to the United Nations Food and Agriculture Organization (FAO) during this period, according to a new Sea Around Us led study out this week in Polar Biology. The Arctic is one of the last and most extensive ocean wilderness areas in the world. The extent of the sea ice in the region has declined in recent years due to climate change, raising concerns over loss of biodiversity as well as the expansion of industrial fisheries into this area. This study offers a more accurate baseline against which to monitor changes in fish catches and to inform policy and conservation efforts. Find the full press release that accompanies the research here and coverage in Nature News here.

Global fishing effort increasing and underestimated

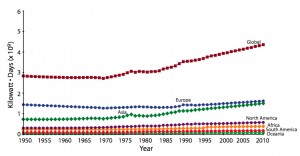
A new study by Sea Around Us Project members examines the global trends in fishing effort from 1950 to 2006 using FAO fisheries data. The analysis confirmed global fishing effort is increasing and that effort is led by Europe and Asia. Trawlers contribute a major fraction of global fishing effort, as do vessels greater than 100 gross registered tons. But the study also notes that there are many limitations to the data, such as the absence of effort data for many countries and the issue of illegal, unreported, and unregulated fishing. This means that the World Bank estimate of $50 billion in fisheries losses due to overcapacity is conservative.

Full citation: Anticamara, J.A., R. Watson, A. Gelchu and D. Pauly. 2011. Global fishing effort (1950-2010): Trends, gaps, and implications. Fisheries Research 107: 131-136.

Sumaila responds to Branch et al. in Nature

Economist Rashid Sumaila recently responded to the paper by Trevor Branch and colleagues in the journal Nature:

The trophic fingerprint of marine fisheries’ (Nature, 468, 431-435, 2010), has intensified the debate on how best to measure the impact of commercial fishing on ocean biodiversity: Is catch data useful in telling us what is happening in the ocean or do we need stock assessment information in order to say something meaningful? As an economist, I cannot contribute to this debate but I can ask some questions: What conclusion does one come to if one uses one or the other of these approaches?If one ends up with the same conclusion then the debate is only of academic interest. If the conclusions reached are different, what are the potential costs to the world should one or the other be incorrect? In general, proponents of the use of stock assessments for measuring the ‘health’ of ocean fish populations, led by Ray Hilborn of the University of Washington, conclude that ocean fish populations are doing just fine, while those who use catch data, spearheaded by Daniel Pauly of the University of British Columbia, come to the conclusion that global fish stocks are in bad shape. Depending on which of these two camps wins the argument, the world would either stick to the status quo and continue to manage global fisheries as we currently do, or the world community would double its efforts to manage global fisheries sustainably. Should the former conclusion turn out to be incorrect, the world would have saved some costs by continuing to fish without further management restrictions, with the consequence that ocean biodiversity would be eroded further, thereby supplying less and less fish with time. On the other hand, if the latter turns out to be incorrect, the world would have incurred unnecessary cost due to stricter management but would have an ocean rich in biodiversity that is capable of supplying fish into the future.

Read more on this issue here.

MSC Critique Chosen As Part of Nature’s Top Six of 2010

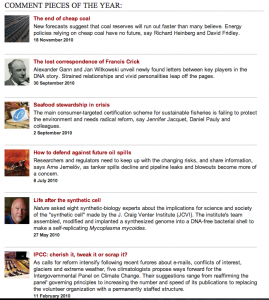
Seafood stewardship in crisis, by Sea Around Us Project members Jennifer Jacquet and Daniel Pauly, as well as David Ainley, Sidney Holt, Paul Dayton & Jeremy Jackson, was chosen as one of Nature’s top six comment pieces of the year. The piece criticizes recent seafood certifications by the Marine Stewardship Council (MSC) and makes suggestions on how the certification could be improved. Read the full piece here.

Scientific American Article Explores Catch Data Controversy

A recent study by Trevor Branch and colleagues asserted that the decline in the mean trophic index is no longer present in the global catch data. But does it really cast doubt on the depletion of big ocean species?

In an article published today at Scientific American, journalist Mike Orcutt explores how best to measure commercial fishing’s impact on ocean biodiversity. He discusses the findings of Brach et al. in light of the new study quantifying fisheries expansion. Orcutt reports:

Pauly says the new PLoS One paper “completely invalidates” Branch’s Nature paper because the authors failed to account for the spatial expansion described in the former. As fisheries move offshore, he says, they first target large fish high on the food web—just as they did closer to shore. “Hence, moving offshore will mask inshore declines in mean trophic levels.”

Read the full article here.

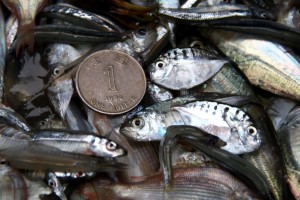
Photo: Tiny fish caught by a trawler off of Hong Kong by Stanley Shea/BLOOM.

New Study Quantifies Expansion of Fisheries

While it is widely-recognized that fishing boats have moved further offshore and deeper in the hunt for seafood, the Sea Around Us Project, in collaboration with the National Geographic Society, recently published in PloS ONE the first study to quantify global fisheries expansion.

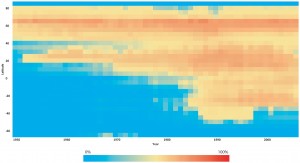
The study reveals that fisheries expanded at a rate of one million sq. kilometres per year from the 1950s to the end of the 1970s. The rate of expansion more than tripled in the 1980s and early 1990s – to roughly the size of Brazil’s Amazon rain forest every year.

Between 1950 and 2005, the spatial expansion of fisheries started from the coastal waters off the North Atlantic and Northwest Pacific, reached into the high seas and southward into the Southern Hemisphere at a rate of almost one degree latitude per year. It was accompanied by a nearly five-fold increase in catch, from 19 million tonnes in 1950, to a peak of 90 million tonnes in the late 1980s, and dropping to 87 million tonnes in 2005. Now we have run out of room to expand fisheries.

The image here (click to enlarge) shows a time series of areas exploited by marine fisheries by latitude class, expressed as a percentage of the total ocean area.

Leah Biery on oil dispersants: The easy way to clean house

At the end of August, I moved to Vancouver from Sanibel Island, Florida. Sanibel is a tiny island in the Gulf of Mexico, where millions of gallons of oil have spilled since the Deepwater Horizon explosion on April 20, 2010. When people learn that I am from the Gulf region, they usually ask how much oil I saw on nearby beaches. Surprisingly, the answer is none.

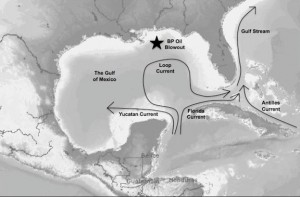
Oil has washed ashore in the northern region of the Gulf, closer to the spill, but southern Florida’s coast appears largely oil-free. The absence of visible oil in southwest Florida is probably due to a combination of natural and anthropogenic factors. The Loop Current flows relatively far offshore, so it has not played a significant part in carrying oil or tarballs to SW Florida’s coastal areas (see figure). Also, major storms with the potential to push oil inland have bypassed the area so far this hurricane season.

Despite the pristine beach conditions in SW Florida, it is important to remember that the lack of visible oil does not necessarily indicate a lack of presence. Chemical dispersants played a key role in hiding surface oil that might otherwise have washed up on beaches today.

Dispersants are chemicals that break oil into small droplets, which are then distributed throughout the water column by wave action and currents. Dispersants do not clean up or get rid of the oil – they simply spread it out. In July alone, the US dropped one third of the world’s supply of dispersants into the Gulf of Mexico, effectively making the oil difficult to find.

You can compare the use of dispersants to a common scenario that most everyone experienced as a child – hiding a mess from your parents. Your mom is angry about the messy state of your room, so she tells you to clean it up. Instead of cleaning up the right way – putting each item where it belongs – you shove everything under the bed, hiding the problem. By using dispersants, the responsible parties were hiding the oil spill instead of cleaning it up.

Hiding the mess is an attractive temporary solution, but the problem becomes apparent when your mom looks under the bed. Now you are in big trouble. The consequences are much worse than if you had just initially taken the responsibility and time to clean up correctly.

A recent study of core samples taken from multiple locations in the Gulf revealed as much as a 5 cm layer of oil on top of the normal bottom sediments. Samantha Joye, a professor from the University of Georgia who collected the core samples, said in an interview with NPR, “The sheer coverage here is leading us all to come to the conclusion that it has to be sedimented oil from the oil spill, because it’s all over the place.” (http://www.npr.org/templates/story/story.php?storyId= 129782098&ps=cprs)

Using dispersants to hide the oil was a fast and easy way to maximize the number of clean beaches and keep the general public happy by making the unpleasant effects of the oil spill appear to go away. However, the long-term environmental and ecological effects of spreading oil throughout the water column are unknown. The Obama administration’s leader of the scientific response to the oil spill, Marcia McNutt, admitted last week that the government decided to use dispersants without prior knowledge of the potential environmental effects, saying “there was no science when you apply [chemical dispersants] in the deep sea — we didn’t know the impacts on sea life.”She also acknowledged that it may be years before we know the full impact of the decision (http://www.poptech.org/blog/marcia_mcnutt_ on_uncertainty_in_the_flow).There is a strong chance that the combination of oil and chemical ingredients in the dispersants will have harmful effects on marine life and potentially the humans who choose to consume that seafood in the near future.

Naturally, oil floats on the surface. This makes it possible (although very difficult) to clean up. Sending oil to the bottom of the ocean makes it virtually impossible to remove. It also damages sea grass beds and coral reefs, and the oil is inadvertently consumed by mussels and other filter feeders – many of which make up the base of the Gulf food web. The chemicals in the oil (mixed with the mysterious chemicals in the dispersants) could accumulate up the food chain over time until high levels are found in commonly-consumed species. The U.S. Food and Drug Administration is monitoring seafood from the Gulf of Mexico carefully, and a number of independent studies are in progress.

The long-term effects of dispersants in the Gulf of Mexico are unclear at this point. The Gulf is one of the world’s top food-producing regions, so dispersants could have huge implications for fisheries. Thanks to dispersants, people in southwest Florida can enjoy the beaches now, but they may not be able to enjoy local seafood safely in the years to come.

Figure: Major currents in the Gulf of Mexico. Near SW Florida, the Loop Current flows far enough offshore that it has not carried oil to beaches.

This article is written by Sea Around Us M.Sc. student Leah Biery

Understanding impacts of the Gulf of Mexico oil spill: How will fisheries fare?

As devastating images of oil in the Gulf of Mexico streamed across virtually every media outlet during the months following the explosion of the Deepwater Horizon on April 20th, 2010, many experts in the fields of marine ecology and fisheries science have found themselves faced with the question, “What will be the impacts of this disaster?” As a native of South Florida with memories of family vacations to Gulf-coast beaches and an appreciation for delicious Gulf seafood, I have been eager to participate in any efforts to better understand the problem.

Attempting to answer this question is no simple task. Estimates of the quantity of oil, natural gas and associated methane, and chemical dispersants released into the Gulf of Mexico are plagued by uncertainty. The U.S. government-appointed team of scientists, a.k.a. the Flow Rate Technical Group, estimated that a total of 4.9 million barrels of oil were released from BP’s Macondo well [1] while an independent study suggested between 4.16 and 6.24 million barrels [2]. According to BP’s records, approximately 1.8 million gallons (i.e., about 6.8 million litres) of dispersant were applied at the site of the leak as well as the sea surface, though the validity of this amount has been questioned [3]. Complex oceanographic processes have made it extremely difficult to determine the current and future distribution of these toxic substances from the surface to the sea floor, and the duration of their persistence in the marine environment. Most importantly, there are no immediate answers to questions concerning short- and long-term impacts on habitats and marine organisms in the path of this disaster. This uncertainty is particularly troubling for fisheries dependent on economically valuable species.

Despite the geographic distance separating the Fisheries Centre from the Gulf of Mexico, the databases developed by the Sea Around Us Project provide a unique opportunity to explore potential effects of the spill on commercial fisheries in this Large Marine Ecosystem (LME). While these databases supply detailed information on a global scale, they may be easily queried to understand trends occurring in smaller geographic regions, such as the Gulf of Mexico. Using data detailing the location and quantity of species reportedly caught by fishers throughout the Gulf [4], in addition to information regarding the price that they receive when they sell their catch [5], spatial maps illustrating recent trends in catch and landed value were generated for this study.

From 2000 to 2005, an average of approximately 850,000 tonnes of fish, crustaceans, molluscs and other invertebrates, primarily inhabiting the highly productive continental shelf area, were commercially caught in the Gulf of Mexico. The majority of this catch originated within the 200 nautical mile limit of the United States’ Exclusive Economic Zone (EEZ), followed by landings within Mexican waters. The total landed value of this catch was estimated at approximately $1.38 billion US.

As oil slicks visible on the sea surface grew in size following the spill, the U.S. National Oceanographic and Atmospheric Administration (NOAA), as well as the States of Florida, Alabama, Mississippi and Louisiana, declared portions of federal and state waters closed to commercial fishing in an effort to promote seafood safety and ensure consumer confidence. The location of this closed area in relation to mapped average catch and landed value was analyzed to provide clues regarding potential economic losses to commercial fisheries in the region.

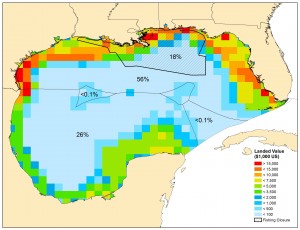
As of July 22, 2010, over 10% of the total surface area of the Gulf and nearly 25% of the US Gulf EEZ was closed to commercial fishing operations. Figure 2 demonstrates that this closure overlapped with highly productive and economically valuable shelf habitats accounting for 18% of the total annual value of reported commercial landings within the Gulf of Mexico LME. This represents a potential annual loss of $247 million to be suffered by U.S. commercial fishers. While the majority of US catch within the closed area during 2000 to 2005 was composed of Gulf menhaden, landings of brown and white shrimp generated the greatest value (12% of the annual US total in the Gulf, combined) due to high consumer demand and associated prices, followed by blue crabs (4%), Gulf menhaden (3%), and eastern oysters (1%). Potential impacts on valuable invertebrate fisheries may be compounded by the fact that relatively immobile, benthic organisms are likely to suffer higher rates of mortality as a result of the toxic effects of oil compared to more mobile fish species [6]. In addition, the capacity of habitats and species to recover from the effects of oil, methane, and dispersants may have already been compromised due to pre-existing sources of stress, including nutrient-laden freshwater discharge from the Mississippi River resulting in periodic oxygen-depleted ‘dead zones’, and bottom habitat destruction due to extensive shrimp trawling.

While this study does not attempt to address the full range of biological and economic consequences of the Deepwater Horizon oil spill on fisheries in the Gulf of Mexico, it does provide a preliminary perspective on one aspect of the puzzle, given pre-oil spill trends. It is evident that the oil spill has clearly impacted an area of crucial economic importance within the Gulf of Mexico.

During the months following the spill, my head has been filled with nostalgic thoughts of flour-like sand squeaking beneath my feet while playing on the beaches of Seaside, Florida, hours spent searching the seashore in Captiva for the beautiful shells that still sit in a bowl in my living room, and devouring a 10 lb bag of steamed clams bought from a fishers by the side of the road in Cedar Key. How will future generations of vacationing families, Gulf-coast residents and fishers remember this region? Hopefully, expectations of environmental resilience along with a continued dedication to clean-up operations will facilitate a swift recovery.

References:

1.http://www.restorethegulf.gov/release/2010/08/02/us-scientific-teams-refine-estimates-oil-flow-bps-well-prior-capping
2. Crone TJ, Tolstoy M (2010) Magnitude of the 2010 Gulf of Mexico Oil Leak. Science 330:634.
3. http://www.ens-newswire.com/ens/aug2010/2010-08-02-091.html
4. Watson R, Kitchingman A, Gelchu A, Pauly D(2004) Mapping global fisheries: sharpening our focus. Fish and Fisheries 5: 168-177.
5. Sumaila R, Marsden AD, Watson R, Pauly D (2007) A global ex-vessel fish price database: construction and applications. Journal of Bioeconomics 9: 39-51.
6. Teal JM, Howarth RW (1984) Oil spill studies: a review of ecological effects. Environmental Management 8: 27-44.

Figure: Spatial distribution of the average (2000-2005) annual landed value of reported commercial fisheries catches in the Gulf of Mexico LME. The area closed to commercial fishing (including both federal and state within the US EEZ as of July 22nd 2010) accounts for approximately 18% of the total value of landings within the LME. The remainder of the US EEZ still open to fishing accounts for 56%, while Mexican waters account for 26% of total landed value. Less than 0.1% of the annual landed value is derived from the two High Seas areas and Cuban waters.

This article written by Sea Around Us post-doctoral fellow Ashley McCrea-Strub and appears in the newsletter.